
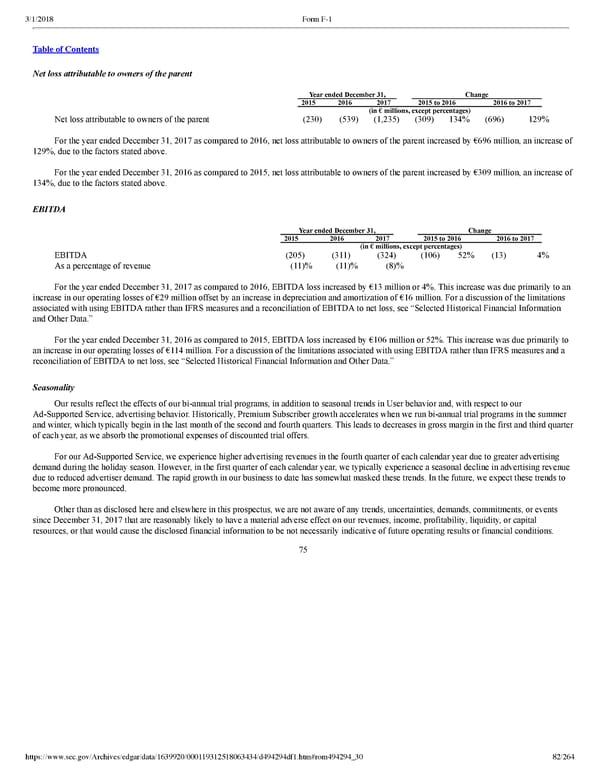
82/264 Net loss attributable to owners of the parent Year ended December 31, Change 2015 2016 2017 2015 to 2016 2016 to 2017 (in € millions, except percentages) Net loss attributable to owners of the parent (230 ) (539 ) (1,235 ) (309 ) 134 % (696 ) 129 % For the year ended December 31, 2017 as compared to 2016, net loss attributable to owners of the parent increased by €696 million, an increase of 129%, due to the factors stated above. For the year ended December 31, 2016 as compared to 2015, net loss attributable to owners of the parent increased by €309 million, an increase of 134%, due to the factors stated above. EBITDA Year ended December 31, Change 2015 2016 2017 2015 to 2016 2016 to 2017 (in € millions, except percentages) EBITDA (205 ) (311 ) (324 ) (106 ) 52 % (13 ) 4 % As a percentage of revenue (11 )% (11 )% (8 )% For the year ended December 31, 2017 as compared to 2016, EBITDA loss increased by €13 million or 4%. This increase was due primarily to an increase in our operating losses of €29 million offset by an increase in depreciation and amortization of €16 million. For a discussion of the limitations associated with using EBITDA rather than IFRS measures and a reconciliation of EBITDA to net loss, see “Selected Historical Financial Information and Other Data.” For the year ended December 31, 2016 as compared to 2015, EBITDA loss increased by €106 million or 52%. This increase was due primarily to an increase in our operating losses of €114 million. For a discussion of the limitations associated with using EBITDA rather than IFRS measures and a reconciliation of EBITDA to net loss, see “Selected Historical Financial Information and Other Data.” Seasonality Our results reflect the effects of our biannual trial programs, in addition to seasonal trends in User behavior and, with respect to our AdSupported Service, advertising behavior. Historically, Premium Subscriber growth accelerates when we run biannual trial programs in the summer and winter, which typically begin in the last month of the second and fourth quarters. This leads to decreases in gross margin in the first and third quarter of each year, as we absorb the promotional expenses of discounted trial offers. For our AdSupported Service, we experience higher advertising revenues in the fourth quarter of each calendar year due to greater advertising demand during the holiday season. However, in the first quarter of each calendar year, we typically experience a seasonal decline in advertising revenue due to reduced advertiser demand. The rapid growth in our business to date has somewhat masked these trends. In the future, we expect these trends to become more pronounced. Other than as disclosed here and elsewhere in this prospectus, we are not aware of any trends, uncertainties, demands, commitments, or events since December 31, 2017 that are reasonably likely to have a material adverse effect on our revenues, income, profitability, liquidity, or capital resources, or that would cause the disclosed financial information to be not necessarily indicative of future operating results or financial conditions. 75
 Spotify F1 | Interactive Prospectus Page 81 Page 83