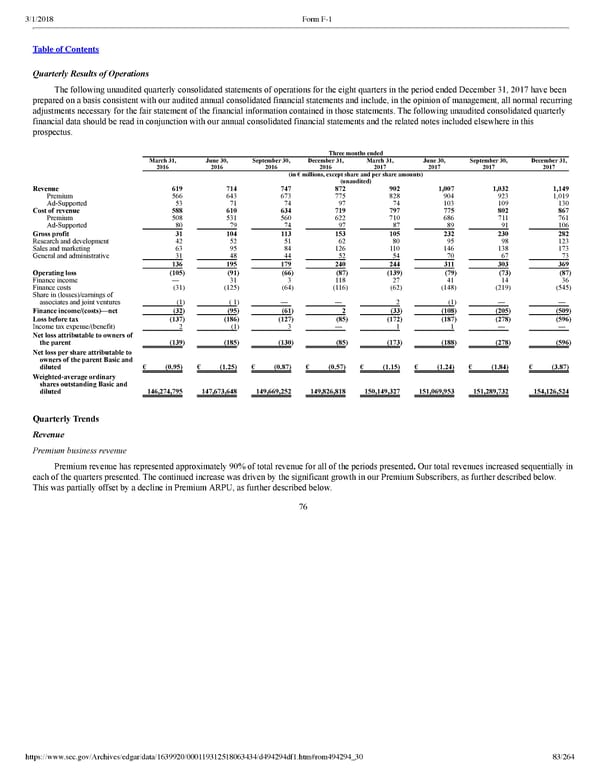
83/264 Quarterly Results of Operations The following unaudited quarterly consolidated statements of operations for the eight quarters in the period ended December 31, 2017 have been prepared on a basis consistent with our audited annual consolidated financial statements and include, in the opinion of management, all normal recurring adjustments necessary for the fair statement of the financial information contained in those statements. The following unaudited consolidated quarterly financial data should be read in conjunction with our annual consolidated financial statements and the related notes included elsewhere in this prospectus. Three months ended March 31, 2016 June 30, 2016 September 30, 2016 December 31, 2016 March 31, 2017 June 30, 2017 September 30, 2017 December 31, 2017 (in € millions, except share and per share amounts) (unaudited) Revenue 619 714 747 872 902 1,007 1,032 1,149 Premium 566 643 673 775 828 904 923 1,019 AdSupported 53 71 74 97 74 103 109 130 Cost of revenue 588 610 634 719 797 775 802 867 Premium 508 531 560 622 710 686 711 761 AdSupported 80 79 74 97 87 89 91 106 Gross profit 31 104 113 153 105 232 230 282 Research and development 42 52 51 62 80 95 98 123 Sales and marketing 63 95 84 126 110 146 138 173 General and administrative 31 48 44 52 54 70 67 73 136 195 179 240 244 311 303 369 Operating loss (105 ) (91 ) (66 ) (87 ) (139 ) (79 ) (73 ) (87 ) Finance income — 31 3 118 27 41 14 36 Finance costs (31 ) (125 ) (64 ) (116 ) (62 ) (148 ) (219 ) (545 ) Share in (losses)/earnings of associates and joint ventures (1 ) ( 1 ) — — 2 (1 ) — — Finance income/(costs)—net (32 ) (95 ) (61 ) 2 (33 ) (108 ) (205 ) (509 ) Loss before tax (137 ) (186 ) (127 ) (85 ) (172 ) (187 ) (278 ) (596 ) Income tax expense/(benefit) 2 (1 ) 3 — 1 1 — — Net loss attributable to owners of the parent (139 ) (185 ) (130 ) (85 ) (173 ) (188 ) (278 ) (596 ) Net loss per share attributable to owners of the parent Basic and diluted € (0.95) € (1.25) € (0.87) € (0.57) € (1.15) € (1.24) € (1.84) € (3.87) Weightedaverage ordinary shares outstanding Basic and diluted 146,274,795 147,673,648 149,669,252 149,826,818 150,149,327 151,069,953 151,289,732 154,126,524 Quarterly Trends Revenue Premium business revenue Premium revenue has represented approximately 90% of total revenue for all of the periods presented . Our total revenues increased sequentially in each of the quarters presented. The continued increase was driven by the significant growth in our Premium Subscribers, as further described below. This was partially offset by a decline in Premium ARPU, as further described below. 76
 Spotify F1 | Interactive Prospectus Page 82 Page 84