
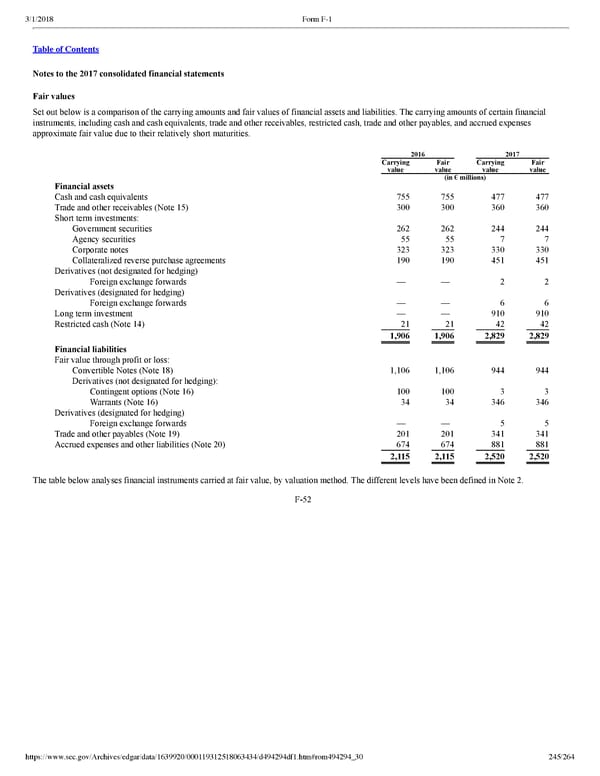
245/264 Notes to the 2017 consolidated financial statements Fair values Set out below is a comparison of the carrying amounts and fair values of financial assets and liabilities. The carrying amounts of certain financial instruments, including cash and cash equivalents, trade and other receivables, restricted cash, trade and other payables, and accrued expenses approximate fair value due to their relatively short maturities. 2016 2017 Carrying value Fair value Carrying value Fair value (in € millions) Financial assets Cash and cash equivalents 755 755 477 477 Trade and other receivables (Note 15) 300 300 360 360 Short term investments: Government securities 262 262 244 244 Agency securities 55 55 7 7 Corporate notes 323 323 330 330 Collateralized reverse purchase agreements 190 190 451 451 Derivatives (not designated for hedging) Foreign exchange forwards — — 2 2 Derivatives (designated for hedging) Foreign exchange forwards — — 6 6 Long term investment — — 910 910 Restricted cash (Note 14) 21 21 42 42 1,906 1,906 2,829 2,829 Financial liabilities Fair value through profit or loss: Convertible Notes (Note 18) 1,106 1,106 944 944 Derivatives (not designated for hedging): Contingent options (Note 16) 100 100 3 3 Warrants (Note 16) 34 34 346 346 Derivatives (designated for hedging) Foreign exchange forwards — — 5 5 Trade and other payables (Note 19) 201 201 341 341 Accrued expenses and other liabilities (Note 20) 674 674 881 881 2,115 2,115 2,520 2,520 The table below analyses financial instruments carried at fair value, by valuation method. The different levels have been defined in Note 2. F52
 Spotify F1 | Interactive Prospectus Page 244 Page 246