
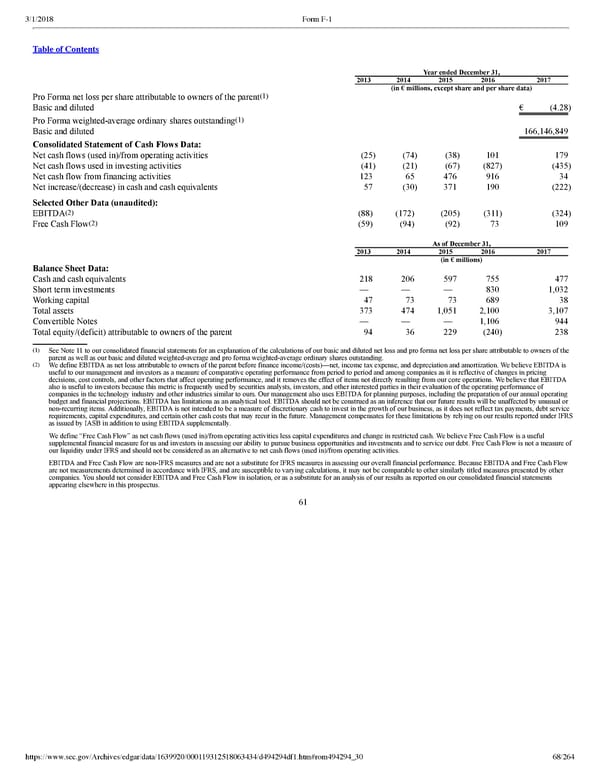
68/264 Year ended December 31, 2013 2014 2015 2016 2017 (in € millions, except share and per share data) Pro Forma net loss per share attributable to owners of the parent (1) Basic and diluted € (4.28 ) Pro Forma weightedaverage ordinary shares outstanding (1) Basic and diluted 166,146,849 Consolidated Statement of Cash Flows Data: Net cash flows (used in)/from operating activities (25 ) (74 ) (38 ) 101 179 Net cash flows used in investing activities (41 ) (21 ) (67 ) (827 ) (435 ) Net cash flow from financing activities 123 65 476 916 34 Net increase/(decrease) in cash and cash equivalents 57 (30 ) 371 190 (222 ) Selected Other Data (unaudited): EBITDA (2) (88) (172) (205 ) (311 ) (324 ) Free Cash Flow (2) (59) (94) (92 ) 73 109 As of December 31, 2013 2014 2015 2016 2017 (in € millions) Balance Sheet Data: Cash and cash equivalents 218 206 597 755 477 Short term investments — — — 830 1,032 Working capital 47 73 73 689 38 Total assets 373 474 1,051 2,100 3,107 Convertible Notes — — — 1,106 944 Total equity/(deficit) attributable to owners of the parent 94 36 229 (240 ) 238 ( 1 ) See Note 11 to our consolidated financial statements for an explanation of the calculations of our basic and diluted net loss and pro forma net loss per share attributable to owners of the parent as well as our basic and diluted weightedaverage and pro forma weightedaverage ordinary shares outstanding. ( 2 ) We define EBITDA as net loss attributable to owners of the parent before finance income/(costs)—net, income tax expense, and depreciation and amortization. We believe EBITDA is useful to our management and investors as a measure of comparative operating performance from period to period and among companies as it is reflective of changes in pricing decisions, cost controls, and other factors that affect operating performance, and it removes the effect of items not directly resulting from our core operations. We believe that EBITDA also is useful to investors because this metric is frequently used by securities analysts, investors, and other interested parties in their evaluation of the operating performance of companies in the technology industry and other industries similar to ours. Our management also uses EBITDA for planning purposes, including the preparation of our annual operating budget and financial projections. EBITDA has limitations as an analytical tool. EBITDA should not be construed as an inference that our future results will be unaffected by unusual or nonrecurring items. Additionally, EBITDA is not intended to be a measure of discretionary cash to invest in the growth of our business, as it does not reflect tax payments, debt service requirements, capital expenditures, and certain other cash costs that may recur in the future. Management compensates for these limitations by relying on our results reported under IFRS as issued by IASB in addition to using EBITDA supplementally. We define “Free Cash Flow” as net cash flows (used in)/from operating activities less capital expenditures and change in restricted cash. We believe Free Cash Flow is a useful supplemental financial measure for us and investors in assessing our ability to pursue business opportunities and investments and to service our debt. Free Cash Flow is not a measure of our liquidity under IFRS and should not be considered as an alternative to net cash flows (used in)/from operating activities. EBITDA and Free Cash Flow are nonIFRS measures and are not a substitute for IFRS measures in assessing our overall financial performance. Because EBITDA and Free Cash Flow are not measurements determined in accordance with IFRS, and are susceptible to varying calculations, it may not be comparable to other similarly titled measures presented by other companies. You should not consider EBITDA and Free Cash Flow in isolation, or as a substitute for an analysis of our results as reported on our consolidated financial statements appearing elsewhere in this prospectus. 61
 Spotify F1 | Interactive Prospectus Page 67 Page 69