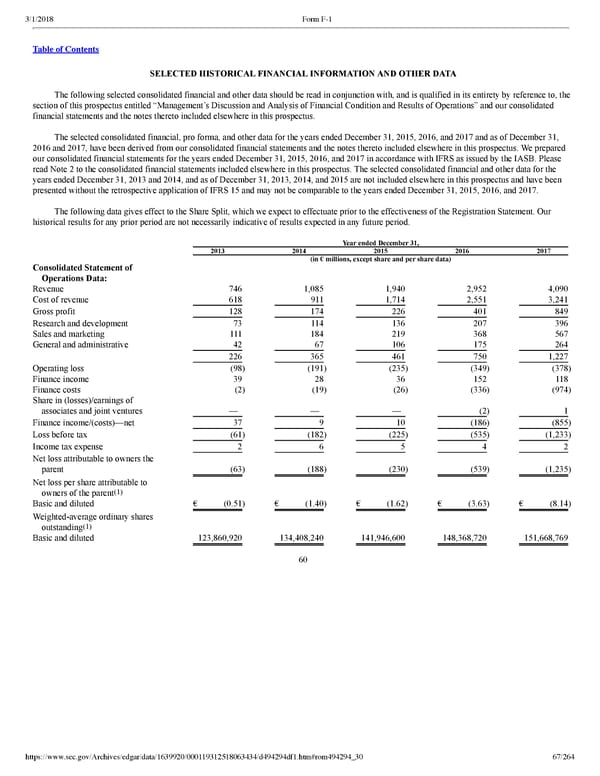
67/264 SELECTED HISTORICAL FINANCIAL INFORMATION AND OTHER DATA The following selected consolidated financial and other data should be read in conjunction with, and is qualified in its entirety by reference to, the section of this prospectus entitled “Management’s Discussion and Analysis of Financial Condition and Results of Operations” and our consolidated financial statements and the notes thereto included elsewhere in this prospectus. The selected consolidated financial, pro forma, and other data for the years ended December 31, 2015, 2016, and 2017 and as of December 31, 2016 and 2017, have been derived from our consolidated financial statements and the notes thereto included elsewhere in this prospectus. We prepared our consolidated financial statements for the years ended December 31, 2015, 2016, and 2017 in accordance with IFRS as issued by the IASB. Please read Note 2 to the consolidated financial statements included elsewhere in this prospectus. The selected consolidated financial and other data for the years ended December 31, 2013 and 2014, and as of December 31, 2013, 2014, and 2015 are not included elsewhere in this prospectus and have been presented without the retrospective application of IFRS 15 and may not be comparable to the years ended December 31, 2015, 2016, and 2017. The following data gives effect to the Share Split, which we expect to effectuate prior to the effectiveness of the Registration Statement. Our historical results for any prior period are not necessarily indicative of results expected in any future period. Year ended December 31, 2013 2014 2015 2016 2017 (in € millions, except share and per share data) Consolidated Statement of Operations Data: Revenue 746 1,085 1,940 2,952 4,090 Cost of revenue 618 911 1,714 2,551 3,241 Gross profit 128 174 226 401 849 Research and development 73 114 136 207 396 Sales and marketing 111 184 219 368 567 General and administrative 42 67 106 175 264 226 365 461 750 1,227 Operating loss (98 ) (191 ) (235 ) (349 ) (378 ) Finance income 39 28 36 152 118 Finance costs (2 ) (19 ) (26 ) (336 ) (974 ) Share in (losses)/earnings of associates and joint ventures — — — (2 ) 1 Finance income/(costs)—net 37 9 10 (186 ) (855 ) Loss before tax (61 ) (182 ) (225 ) (535 ) (1,233 ) Income tax expense 2 6 5 4 2 Net loss attributable to owners the parent (63 ) (188 ) (230 ) (539 ) (1,235 ) Net loss per share attributable to owners of the parent (1) Basic and diluted € (0.51 ) € (1.40 ) € (1.62 ) € (3.63 ) € (8.14 ) Weightedaverage ordinary shares outstanding (1) Basic and diluted 123,860,920 134,408,240 141,946,600 148,368,720 151,668,769 60
 Spotify F1 | Interactive Prospectus Page 66 Page 68