
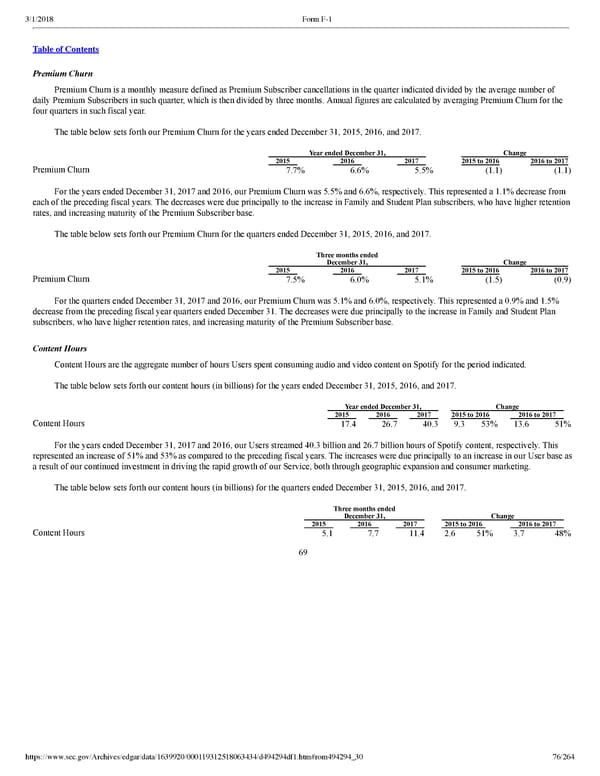
76/264 Premium Churn Premium Churn is a monthly measure defined as Premium Subscriber cancellations in the quarter indicated divided by the average number of daily Premium Subscribers in such quarter, which is then divided by three months. Annual figures are calculated by averaging Premium Churn for the four quarters in such fiscal year. The table below sets forth our Premium Churn for the years ended December 31, 2015, 2016, and 2017. Year ended December 31, Change 2015 2016 2017 2015 to 2016 2016 to 2017 Premium Churn 7.7 % 6.6 % 5.5 % (1.1 ) (1.1 ) For the years ended December 31, 2017 and 2016, our Premium Churn was 5.5% and 6.6%, respectively. This represented a 1.1% decrease from each of the preceding fiscal years. The decreases were due principally to the increase in Family and Student Plan subscribers, who have higher retention rates, and increasing maturity of the Premium Subscriber base. The table below sets forth our Premium Churn for the quarters ended December 31, 2015, 2016, and 2017. Three months ended December 31, Change 2015 2016 2017 2015 to 2016 2016 to 2017 Premium Churn 7.5 % 6.0 % 5.1 % (1.5 ) (0.9 ) For the quarters ended December 31, 2017 and 2016, our Premium Churn was 5.1% and 6.0%, respectively. This represented a 0.9% and 1.5% decrease from the preceding fiscal year quarters ended December 31. The decreases were due principally to the increase in Family and Student Plan subscribers, who have higher retention rates, and increasing maturity of the Premium Subscriber base. Content Hours Content Hours are the aggregate number of hours Users spent consuming audio and video content on Spotify for the period indicated. The table below sets forth our content hours (in billions) for the years ended December 31, 2015, 2016, and 2017. Year ended December 31, Change 2015 2016 2017 2015 to 2016 2016 to 2017 Content Hours 17.4 26.7 40.3 9.3 53 % 13.6 51 % For the years ended December 31, 2017 and 2016, our Users streamed 40.3 billion and 26.7 billion hours of Spotify content, respectively. This represented an increase of 51% and 53% as compared to the preceding fiscal years. The increases were due principally to an increase in our User base as a result of our continued investment in driving the rapid growth of our Service, both through geographic expansion and consumer marketing. The table below sets forth our content hours (in billions) for the quarters ended December 31, 2015, 2016, and 2017. Three months ended December 31, Change 2015 2016 2017 2015 to 2016 2016 to 2017 Content Hours 5.1 7.7 11.4 2.6 51 % 3.7 48 % 69
 Spotify F1 | Interactive Prospectus Page 75 Page 77