
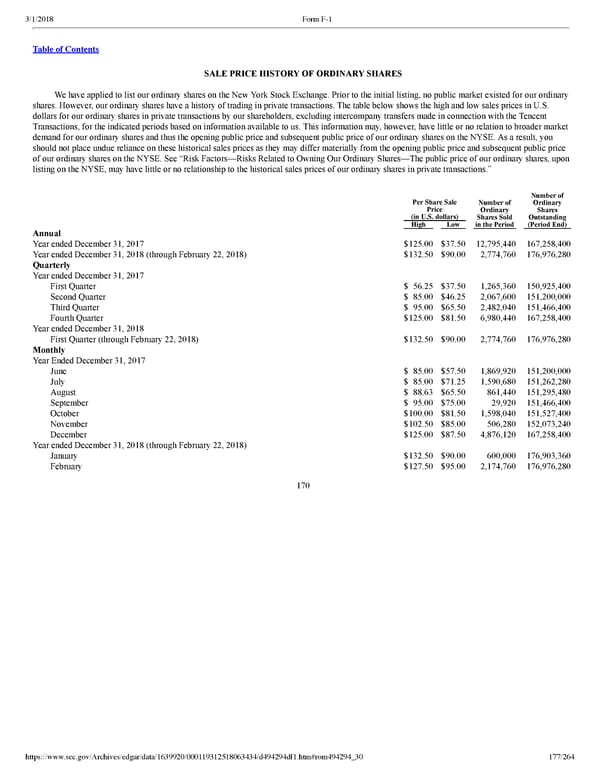
177/264 SALE PRICE HISTORY OF ORDINARY SHARES We have applied to list our ordinary shares on the New York Stock Exchange. Prior to the initial listing, no public market existed for our ordinary shares. However, our ordinary shares have a history of trading in private transactions. The table below shows the high and low sales prices in U.S. dollars for our ordinary shares in private transactions by our shareholders, excluding intercompany transfers made in connection with the Tencent Transactions, for the indicated periods based on information available to us. This information may, however, have little or no relation to broader market demand for our ordinary shares and thus the opening public price and subsequent public price of our ordinary shares on the NYSE. As a result, you should not place undue reliance on these historical sales prices as they may differ materially from the opening public price and subsequent public price of our ordinary shares on the NYSE. See “Risk Factors—Risks Related to Owning Our Ordinary Shares—The public price of our ordinary shares, upon listing on the NYSE, may have little or no relationship to the historical sales prices of our ordinary shares in private transactions.” Per Share Sale Price (in U.S. dollars) Number of Ordinary Shares Sold in the Period Number of Ordinary Shares Outstanding (Period End) High Low Annual Year ended December 31, 2017 $ 125.00 $ 37.50 12,795,440 167,258,400 Year ended December 31, 2018 (through February 22, 2018) $ 132.50 $ 90.00 2,774,760 176,976,280 Quarterly Year ended December 31, 2017 First Quarter $ 56.25 $ 37.50 1,265,360 150,925,400 Second Quarter $ 85.00 $ 46.25 2,067,600 151,200,000 Third Quarter $ 95.00 $ 65.50 2,482,040 151,466,400 Fourth Quarter $ 125.00 $ 81.50 6,980,440 167,258,400 Year ended December 31, 2018 First Quarter (through February 22, 2018) $ 132.50 $ 90.00 2,774,760 176,976,280 Monthly Year Ended December 31, 2017 June $ 85.00 $ 57.50 1,869,920 151,200,000 July $ 85.00 $ 71.25 1,590,680 151,262,280 August $ 88.63 $ 65.50 861,440 151,295,480 September $ 95.00 $ 75.00 29,920 151,466,400 October $ 100.00 $ 81.50 1,598,040 151,527,400 November $ 102.50 $ 85.00 506,280 152,073,240 December $ 125.00 $ 87.50 4,876,120 167,258,400 Year ended December 31, 2018 (through February 22, 2018) January $ 132.50 $ 90.00 600,000 176,903,360 February $ 127.50 $ 95.00 2,174,760 176,976,280 170
 Spotify F1 | Interactive Prospectus Page 176 Page 178