
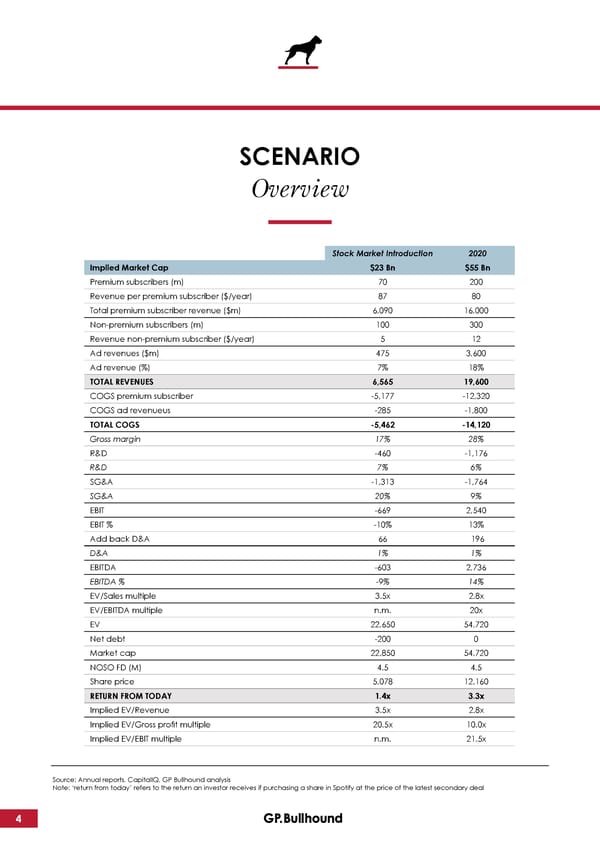
SCENARIO Overview Stock Market Introduction 2020 Implied Market Cap $23 Bn $55 Bn Premium subscribers (m) 70 200 Revenue per premium subscriber ($/year) 87 80 Total premium subscriber revenue ($m) 6,090 16,000 Non-premium subscribers (m) 100 300 Revenue non-premium subscriber ($/year) 5 12 Ad revenues ($m) 475 3,600 Ad revenue (%) 7% 18% TOTAL REVENUES 6,565 19,600 COGS premium subscriber -5,177 -12,320 COGS ad revenueus -285 -1,800 TOTAL COGS -5,462 -14,120 Gross margin 17% 28% R&D -460 -1,176 R&D 7% 6% SG&A -1,313 -1,764 SG&A 20% 9% EBIT -669 2,540 EBIT % -10% 13% Add back D&A 66 196 D&A 1% 1% EBITDA -603 2,736 EBITDA % -9% 14% EV/Sales multiple 3.5x 2.8x EV/EBITDA multiple n.m. 20x EV 22,650 54,720 Net debt -200 0 Market cap 22,850 54,720 NOSO FD (M) 4.5 4.5 Share price 5,078 12,160 RETURN FROM TODAY 1.4x 3.3x Implied EV/Revenue 3.5x 2.8x Implied EV/Gross profit multiple 20.5x 10.0x Implied EV/EBIT multiple n.m. 21.5x Source: Annual reports, CapitalIQ, GP Bullhound analysis Note: ‘return from today’ refers to the return an investor receives if purchasing a share in Spotify at the price of the latest secondary deal 4
 GP Bullhound Spotify Update October 2017 Page 3 Page 5